Administration Console
Assumptions:
-
You have Diferencia running (in case of Docker with admin port exposed). Default admin port is
8082.
Configuration
By default the admin console is listening port 8082 but it can be configured by using --adminPort argument.
|
Rest API
Getting Configuration
Diferencia has an administration console that can be accessed as a Rest API to get configuration values.
To get it you need to use GET http method to /configuration endpoint to given host and configured port.
The JSON document of response is:
{
  "port": 8080,
  "serviceName": "now.httpbin.org",
  "primary": "http://now.httpbin.org/",
  "secondary": "http://now.httpbin.org",
  "candidate": "http://now.httpbin.org/",
  "prometheusPort": 8081,
  "adminPort": 8082
  ... (1)
}| 1 | All configuration parameters are exposed using camel case. |
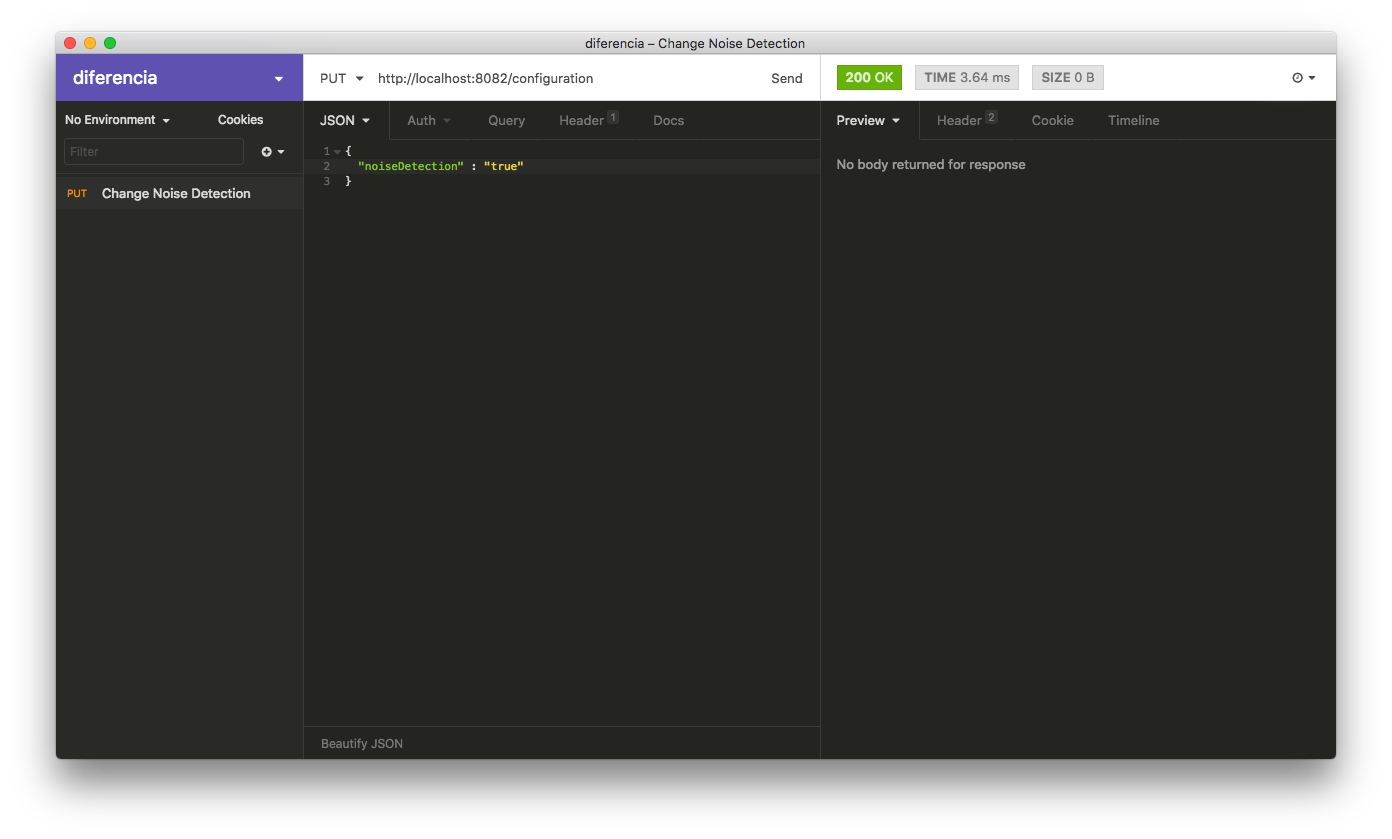
Updating Configuration
Diferencia has an administration console that can be accessed as a Rest API to configure some of the Diferencia parameters without having to restart it. At this time these parameters are:
-
serviceName
-
primary
-
candidate
-
secondary
-
noise detection
-
mode
To update any of the parameters you only need to send a JSON document using PUT http method to /configuration endpoint to given host and configured port.
The JSON document must follow next schema:
{
  "serviceName" : "",
  "primary" : "",
  "secondary" : "",
  "candidate" : "",
  "secondary" : "",
  "noiseDetection" : "", (1)
  "mode" : "" (2)
}| 1 | Noise Detection valid values is: Strict, Subset and Schema |
| 2 | Boolean as string true or false |
| You can set all parameters to be updated in the document, and all of them will be updated at once. It is not necessary to send N requests one for each change. |
Stats
Rest API
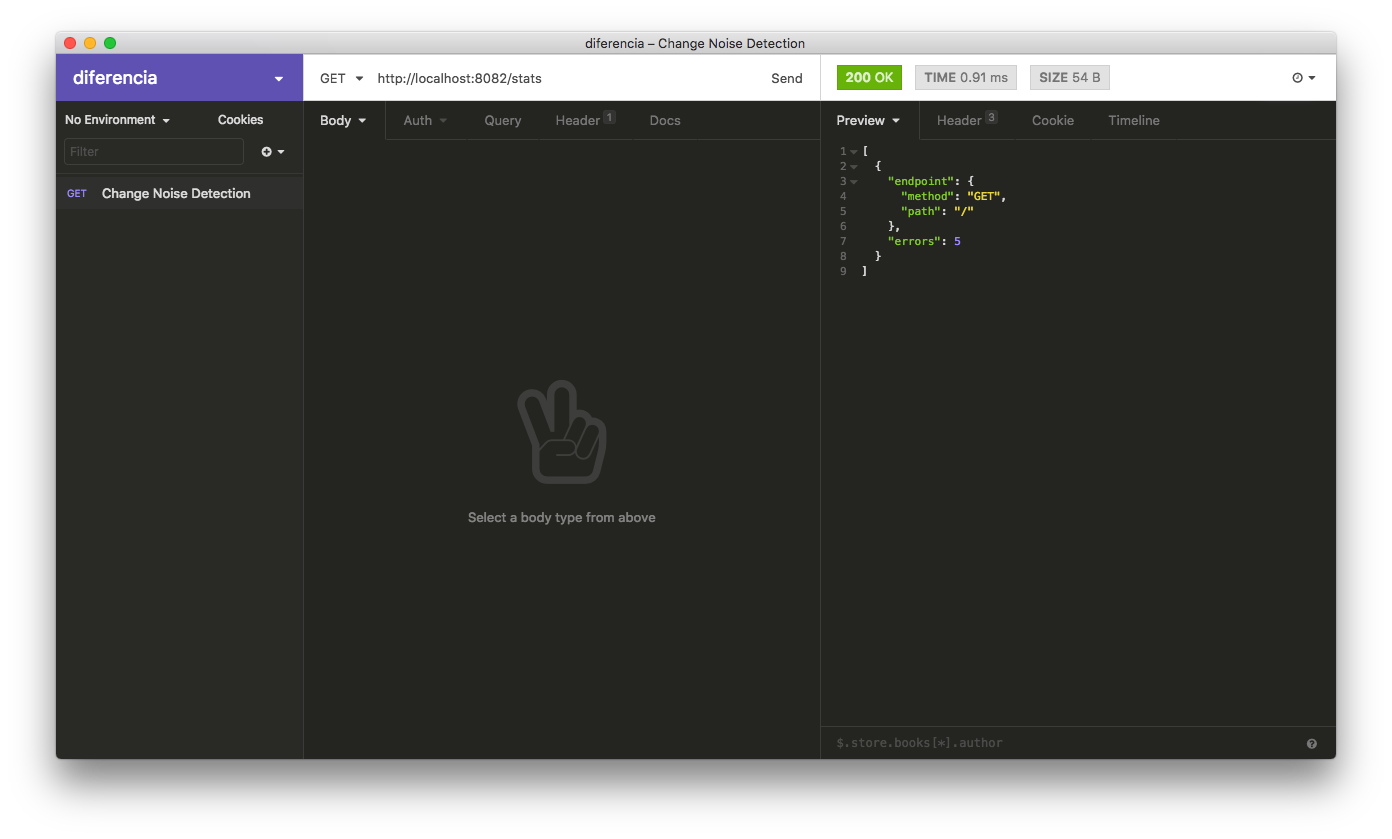
Getting Stats
Diferencia collects stats of the failing endpoints so you can get which endpoints are failing and how many times they have failed. In future, these stats can be improved offering more information, for now it just offers basic information.
To get stats you only need to use GET http method to /stats endpoint to given host and configured port.
And the response is:
[
	{
		"endpoint": {
			"method": "GET", (1)
			"path": "/" (2)
		},
		"errors": 5 (3)
	}
]| 1 | Http method used in request |
| 2 | Path used to replicate |
| 3 | Number of errors |
| Only endpoints with errors are returned, if there is no errors then empy array is returned. |